Table of Contents
Finding CPU utilization is one of the important tasks. Linux comes with various utilities to report CPU utilization. With these commands, you will be able to find out:
- CPU utilization.
- Display the utilization of each CPU individually (SMP cpu).
- Find out your system’s average CPU utilization since the last system. reboot.
- Determine which process is eating the CPU(s).
Using the top command
The top command under Linux furnishes a dynamic real-time view of a running system. It can display system summary info and a list of tasks currently managed by the Linux kernel.
topThe system should respond by displaying a list of all the processes that are currently running. It will also give a readout of users, tasks, CPU load, and memory usage.
top - 16:42:16 up 2 days, 23:47,  1 user,  load average: 0.60, 1.10, 1.32
Tasks:  65 total,   2 running,  63 sleeping,   0 stopped,   0 zombie
%Cpu(s):  6.5 us,  0.6 sy,  0.0 ni, 92.9 id,  0.0 wa,  0.0 hi,  0.0 si,  0.0 st
KiB Mem :  3145728 total,  1124940 free,  1519876 used,   500912 buff/cache
KiB Swap:  1048576 total,   925172 free,   123404 used.  1510696 avail Mem

  PID USER      PR  NI    VIRT    RES    SHR S  %CPU %MEM     TIME+ COMMAND
28195 nginx     20   0  533824 120348  85820 S   7.3  3.8 117:02.12 php-fpm
25875 nginx     20   0  524136 100916  73884 R   6.0  3.2 117:51.38 php-fpm
17746 mysql     20   0 2923556 293128  23648 S   3.0  9.3   0:24.76 mariadbd
    1 root      20   0   51564   3360   2548 S   0.3  0.1   0:56.28 systemd
  389 redis     20   0  186824  22092   1816 S   0.3  0.7   3:40.59 redis-server
16968 nginx     20   0   50668   6984   3400 S   0.3  0.2   0:11.53 nginx
...By default, the processes are ordered by percentage of CPU usage, with only the “top” CPU consumers shown. The top command shows how much processing power and memory are being used, as well as other information about the running processes.
top -tThis hides all the idle processes, making it easier to sort through the list.
top - 16:47:31 up 2 days, 23:52,  1 user,  load average: 0.43, 0.64, 1.05
Tasks:  65 total,   2 running,  63 sleeping,   0 stopped,   0 zombie
%Cpu(s): 33.1 us,  2.1 sy,  0.0 ni, 64.8 id,  0.0 wa,  0.0 hi,  0.0 si,  0.0 st
KiB Mem :  3145728 total,  1080760 free,  1539080 used,   525888 buff/cache
KiB Swap:  1048576 total,   930592 free,   117984 used.  1488248 avail Mem

  PID USER      PR  NI    VIRT    RES    SHR S  %CPU %MEM     TIME+ COMMAND
 1734 nginx     20   0  537656 123648  83536 S  37.7  3.9 114:35.79 php-fpm
17746 mysql     20   0 2989092 299116  23712 S  11.7  9.5   0:39.73 mariadbd
  865 nginx     20   0  530752 110664  78528 S  10.7  3.5 170:13.80 php-fpm
 7581 nginx     20   0  526512 120284  88520 S   9.3  3.8  42:35.93 php-fpm
 1735 nginx     20   0  527200 110224  78160 S   8.7  3.5 113:34.34 php-fpm
25903 nginx     20   0 1540620 110092  75024 R   4.7  3.5 119:07.54 php-fpm
Using the htop command
The htop command is equivalent to the top command but allows you to scroll vertically, horizontally, and much more. Open the terminal app and type the following:
htop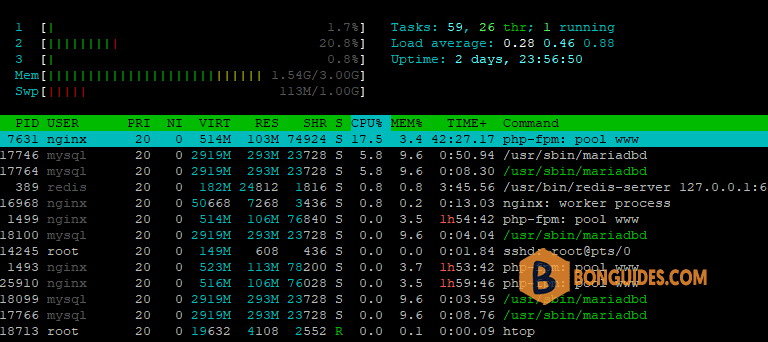
Using the sysstat command
Please note that you need to install a special package called sysstat to take advantage of following commands. This package includes system performance tools for Linux (Red Hat Linux / RHEL includes these tools by default).
###Debian or Ubuntu Linux
sudo apt-get -y install sysstat

###CentOS/RHEL/Oracle Linux v5.x+ or newer
sudo yum -y install sysstat

###Fedora, Rocky, CentOS Stream, Alma Linux and RHEL latest version
sudo dnf -y install sysstat
Once the process finishes, you can use the mpstat command in the terminal as follows:
mpstat -P ALL# mpstat -P ALL
Linux 4.18.0-408.el8.x86_64 (ct8) 10/27/2022 _x86_64_ (3 CPU)
06:00:05 AM CPU %usr %nice %sys %iowait %irq %soft %steal %guest %gnice %idle
06:00:05 AM all 0.48 0.00 0.21 0.03 0.10 0.06 0.00 0.00 0.00 99.12
06:00:05 AM 0 0.98 0.00 0.14 0.00 0.11 0.06 0.00 0.00 0.00 98.70
06:00:05 AM 1 0.17 0.00 0.22 0.02 0.13 0.11 0.00 0.00 0.00 99.36
06:00:05 AM 2 0.29 0.00 0.27 0.06 0.06 0.01 0.00 0.00 0.00 99.30The system will display usage for each processor (or processor core).
- %usr – % CPU usage at the user level
- %nice – % CPU usage for user processes labeled “nice”
- %sys – % CPU usage at the system (Linux kernel) level
- %iowait – % CPU usage idling waiting on a disk read/write
- %irq – % CPU usage handling hardware interrupts
- %soft – % CPU usage handing software interrupts
- %steal – % CPU usage being forced to wait for a hypervisor handling other virtual processors
- %guest – % CPU usage spent running a virtual processor
- %idle – % CPU usage on idle time (no processes, and not waiting on a disk read/write)
iostat Command for Average Usage
The system will display average CPU usage since the last boot. It will also display input/output load (disk read/write activity).
iostat# iostat
Linux 4.18.0-408.el8.x86_64 (ct8) 10/27/2022 _x86_64_ (3 CPU)
avg-cpu: %user %nice %system %iowait %steal %idle
0.41 0.00 0.34 0.02 0.00 99.22
Device tps kB_read/s kB_wrtn/s kB_read kB_wrtn
nvme0n1 10.85 391.25 43.53 495616 55136
scd0 0.01 0.00 0.00 1 0
dm-0 10.08 348.69 40.29 441697 51040
dm-1 0.08 1.75 0.00 2220 0
dm-2 0.12 0.98 1.62 1236 2048Other Options to Monitor CPU Performance
Nmon Monitoring Tool
Nmon is a monitoring tool developed by Nigel Griffiths of IBM. To install Nmon Linux, enter the following:
###Debian or Ubuntu Linux
sudo apt-get install nmon

###CentOS/RHEL/Oracle Linux v5.x+ or newer
sudo yum install nmon

###Fedora, Rocky, CentOS Stream, Alma Linux and RHEL latest version
sudo dnf install nmonnmonThis will launch the utility, and display all the options. To view CPU usage, press the letter c. To switch back, press c again. For a list of commands, press h. To quit, press q.
x   ------------------------------
x    _ __  _ __ ___   ___  _ __          For help type H or ...
x   | '_ \| '_ ` _ \ / _ \| '_ \          nmon -?  - hint
x   | | | | | | | | | (_) | | | |         nmon -h  - full details
x   |_| |_|_| |_| |_|\___/|_| |_|
x                                        To stop nmon type q to Quit
x   ------------------------------
x
x   CentOS Stream release 8 VERSION="8"
x   Vendor=GenuineIntel Model=Intel(R) Core(TM) i5-8400 CPU @ 2.80GHz
x   MHz=2808.002 bogomips=5616.00          lscpu:CPU=3 Little Endian
x   ProcessorChips=1 PhysicalCores=3             Sockets=1 Cores=3 Thrds=1
x                    VirtualCPUs =3              MHz=2808 max=0 min=0
x
x   Use these keys to toggle statistics on/off:
x     c = CPU         l = CPU Long-term     - = Faster screen updates
x     C = " WideView  U = Utilisation       + = Slower screen updates
x     m = Memory      V = Virtual memory    j = File Systems
x     d = Disks       n = Network           . = only busy disks/procs
x     r = Resource    N = NFS               h = more options
x     k = Kernel      t = Top-processes     q = Quit
The CPU usage in Nmon Monitoring Tool.
x---------------------------+-------------------------------------------------+
xCPU User%  Sys% Wait%  Idle|0          |25         |50          |75       100|
x  1   0.0   0.0   0.0 100.0|>                                                |
x  2   0.0   0.5   0.0  99.5|>                                                |
x  3   0.0   0.0   0.0 100.0|>                                                |
x---------------------------+-------------------------------------------------+
xAvg   0.0   0.2   0.0  99.8|>                                                |
x---------------------------+-------------------------------------------------+
Using the vmstat command
The vmstat command displays info about Linux processes, memory, paging, block IO, traps, disks and cpu activity. Run the vmstat as follows:
vmstat
vmstat [options] vmstat [interval] [count]
procs -----------memory---------- ---swap-- -----io---- -system-- ------cpu-----
r b swpd free buff cache si so bi bo in cs us sy id wa st
1 0 0 2728212 4204 555596 0 0 89 12 83 108 0 0 99 0 0
0 0 0 2728068 4204 555636 0 0 0 0 224 259 0 0 100 0 0
0 0 0 2728100 4204 555636 0 0 0 0 199 242 0 0 100 0 0
0 0 0 2728100 4204 555636 0 0 0 0 210 240 0 0 100 0 0
0 0 0 2728100 4204 555636 0 0 0 0 228 262 0 0 100 0 0
0 0 0 2728100 4204 555636 0 0 0 0 230 251 0 0 100 0 0
0 0 0 2728100 4204 555636 0 0 0 0 222 246 0 0 100 0 0
0 0 0 2728072 4204 555636 0 0 0 0 245 270 0 0 100 0 0
0 0 0 2728072 4204 555636 0 0 0 0 302 318 0 0 99 0 0
0 0 0 2728072 4204 555636 0 0 0 0 215 260 0 1 99 0 0
0 0 0 2728072 4204 555636 0 0 0 0 241 259 0 0 100 0 0